Chart Types - Visualize Your Data Sets
Infographic diagrams can contain various data charts. They allow you to visualize your data sets. The individual charts have a lot of configuration options.
These basic chart types are supported:
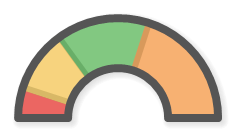
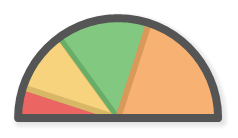
- Circular Charts - pie chart, donut chart, arrowed cycle chart, arc chart, semicircle chart
- Arc Bar Chart
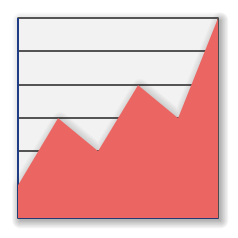
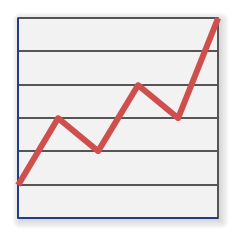
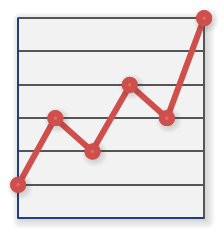
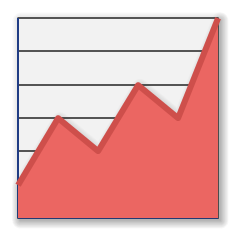
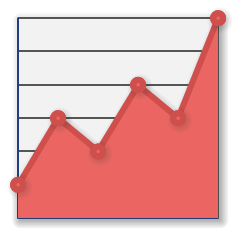
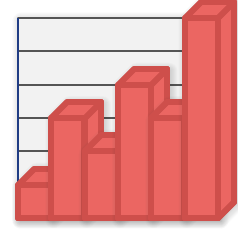
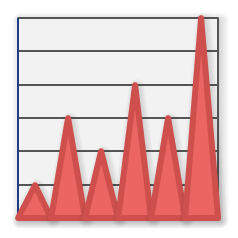
- Area Charts - area bar chart, area chart, funnel chart, line chart, point chart, line point chart, area line chart, area line point chart, spike chart, 3d bar chart
- Bar Chart
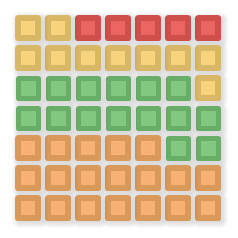
- Table Chart
- Spider Chart
- Tree Map Chart









New Comment